

Nate Silver let the cat out of the bag.
In case you don’t recognize his name, Nate Silver is the data analyst who launched Five Thirty-Eight, orignally in the New York Times. He was famous for not predicting an election a few years ago.
Today, Nate unloaded on the media for just one aspect of their narrative-driven Coronavirus coverage. In short, noted the same thing Hennessy’s View pointed out a month ago: positive tests is meaningless unless it’s indexed to the number of tests administered.
Here’s Nate’s blog posts:
Not providing context on the increase in testing is such a basic error, and has been so widespread, that it's revealing about the media's goals. It's more interested in telling plausibly-true stories ("narratives") that sound smart to its audience than in accuracy/truth per se. https://t.co/abYbgkVFbj
— Nate Silver (@NateSilver538) May 7, 2020
Silver goes on to point out that Donald Trump has figured it out:
BTW, Trump has figured this out! By focusing on case counts, the media creates disincentives to do more testing because it makes the numbers look superficially worse. One reason (not the only one) why we're not pushing for testing as much as we should.https://t.co/lDxP8CMueL
— Nate Silver (@NateSilver538) May 7, 2020
So, the scum media have been called out by a liberal member of their club. Good for Nate.
Here’s how this works:
If you test 1 million people for anything, you will get more total positives than if you test only 100,000. That fact is so obvious, I shouldn’t have to say it. But the media either don’t know it or intentionally conceal it.
To illustrate, this chart shows the percentage of positive tests over the past few weeks. The light blue line is the 7-day moving average:
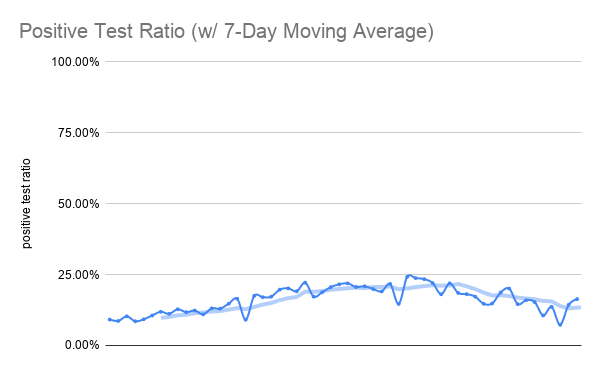
The average is moving down since a peak in the first week of April. That means, for every 100 tests administered, about 16 are positive and 84 are negative.
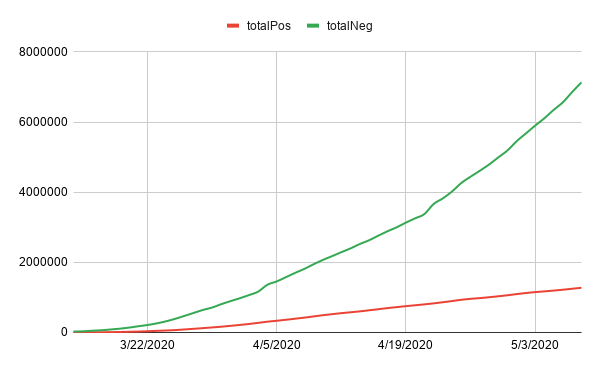
The media fail to report that the number of tests administered has been rising exponentially every day in the first of April. So the spread between total positives and total negatives has grown enormous.
Do you think the media are intentionally deceiving people or are they just too stupid to know what they’re talking about? (It isn’t just the media. A lot of “experts” deceive the same way.)
Do They Even Know How to Think? #
Another example comes in the current debate over COVID-19 death counts.
First, we know that CDC guidelines instructs doctors to list COVID-19 as the cause of death if the decedent might have had COVID-19.
Second, we know that New York, Pennsylvania, and possibly other states retroactively recategorized thousands of deaths as COVID-19, even though the decedents had never been tested or, as far as anyone knows, displays symptoms of Coronavirus.
Third, the federal government pays states and hospitals a $13,000 bounty for every death categorized as COVID-19. If you don’t think greedy politicians like Andrew Cuomo and hospital administrations will fudge the paperwork for $13k per head, you haven’t been paying attention.
Fourth, and this is crucially important, we know that, despite the pandemic, the death count by all causes is down from expected numbers.
Just those facts would lead any thinking person to conclude that the official COVID-19 death count is inflated. But Jonathan Temte of University of Wisconsin-Madison doesn’t see it that way.
Citing a single statistic, COVID-19 as a percentage of all weekly deaths, Temte explains that, in a bad flu year, flu and pneumonia account for 10 percent of deaths in a given week. But in the week of April 11, 2020, COVID-19 accounted for 23.5 percent of all deaths. “I’ve never seen anything like this,” he says.
While Temte could be right, he seems to be suffering from “what you see is all there is,” or WYSIATI, as Danial Kahneman calls it. From Thinking, Fast and Slow, an explanation of WYSIATI:
An essential design feature of the associative machine is that it represents only activated ideas. Information that is not retrieved (even unconsciously) from memory might as well not exist.
Temte leaves off an important number: the numerator. If the overall number of deaths is down, and entire categories of deaths (like industrial accidents and car crashes) are down compared to similar periods in prior years, each death’s cause will have an outsized effect on categorization. I’ll show you how this works in a simple table:
| Year | Cause of Death | Number of Deaths | % | |
|---|---|---|---|---|
| 2017 | Flu & Pneumonia | 1,000 | 10% | |
| 2017 | Accidents (all) | 2,000 | 20% | |
| 2017 | All Causes | 10,000 | 100% | |
| 2018 | Flu & Pneumonia | 800 | 8% | |
| 2018 | Accidents (all) | 2,000 | 20% | |
| 2018 | All Causes | 10,000 | 100% | |
| 2020 | Flu & Pneumonia | 500 | 6% | |
| 2020 | Accidents (all) | 500 | 6% | |
| 2020 | COVID-19 | 1,880 | 23.5% | |
| 2020 | All Causes | 8,000 | 100% |
(Remember, I’m just making up most of these numbers.)
Notice that in 2020, deaths from all causes are down 20%, and flu deaths are down, too. Accidents are way down from recent historical numbers, because people are driving way less, and many dangerous jobs are shut down. Under these conditions, 1,880 deaths attributed to a single cause drive up that cause’s percentage of total deaths.
The point is, without knowing how many people died of all causes in the comparison month, the statistic Temte cites is meaningless. There’s not enough information to draw any conclusion.
Temte also fails to take into account the various ways doctors and governors are incented to categorize every death as a COVID death. He assumes that every reported COVID death means that the primary or sole cause of death was COVID. We know that’s not the case.
Imagine if the CDC told doctors to list the cause of death as automobile accident if there’s any suspicion that the decedent had driven or ridden in a car in the 24 hours before he died. On top of that, we’ll give you $13,000 for each death where automobile accident is the cause. How many more deaths by car accident do you think would magically appear? By comparison, heart disease, cancer, and diabetes would appear to have been cured!
Look, I’m not saying this Temte fellow is lying or that he is incompetent in math and statistics. I am saying that, even a math genius is useless if he can’t discern what matters. And Temte appears not to know what matters. He seems to lack critical thinking skills.
The Secret is Critical Thinking #
The reason there’s such a split between the worriers and the brave is due, in part, to lack of critical thinking skills in so much of the population. And critical thinking requires no book knowledge. It just requires a little healthy skepticism.
The worriers are worried because they don’t think about statistics reported by “experts.” They just assume a doctor knows what he’s talking about and speaks the truth.
For example, suppose an education researcher discovered that, when all other factors are controlled for, the biggest difference in success in life is how many students were in your high school?
Researchers did, in fact, discover this. Students who graduated from high schools of 500 or fewer students performed better in college and after college than students who attended large schools.
When presented this information, the worriers say, “we need to make all high schools small.”
What do critical thinkers say?
“What about students who performed worse than average?”
Why?
What if worse-performing students also tended to come from schools with fewer than 500 students? Then, the initial study was not only meaningless, it was misleading.
How the Gates Foundation Screwed Up Pennsylvania’s Schools #
The scenario above actually happened. The Gates Foundation, failing to apply critical thinking to a study on life success of students in America, paid over one billion dollars to break up Pennsylvania’s high schools into small, 500-student institutions. When student outcomes didn’t improve (and some got worse), someone looked at the data and realize that small school was a predictor of both above average performance and below average performance.
From the awesome book, Thinking, Fast and Slow by Nobel Laureate Daniel Kahneman:
In a survey of 1,662 schools in Pennsylvania, for instance, 6 of the top 50 were small, which is an overrepresentation by a factor of 4. These data encouraged the Gates Foundation to make a substantial investment in the creation of small schools, sometimes by splitting large schools into smaller units. At least half a dozen other prominent institutions, such as the Annenberg Foundation and the Pew Charitable Trust, joined the effort, as did the U.S. Department of Education’s Smaller Learning Communities Program.
And what was the result?
Unfortunately, the causal analysis is pointless because the facts are wrong. If the statisticians who reported to the Gates Foundation had asked about the characteristics of the worst schools, they would have found that bad schools also tend to be smaller than average. The truth is that small schools are not better on average; they are simply more variable. If anything, say Wainer and Zwerling, large schools tend to produce better results, especially in higher grades where a variety of curricular options is valuable.
A billion dollars wasted, and once proud high schools with histories were laid to dust because of a lack of critical thinking. In other words, what they saw wasn’t all there was.
Doubt Everything #
The fact is, as this blog has pointed out, experts are usually wrong. We take their words for granted at our own peril. (Below is a list of previous posts talking about experts.)
When you hear any expert state a fact, before looking it up, as yourself about the opposite. If it’s about small schools and high achievers, ask about the low achievers. If it’s about Coronavirus positive tests, ask about the negative tests. If it’s about total Coronavirus deaths, ask about Coronavirus survivors.
Further, assume that every expert has a hidden agenda, because most do. Dr. Fauci is associated with the Gates Foundation, the World Health Organization, and financially involved with many pharmaceutical companies. He has an incentive steer the public toward expensive, patented drugs and away from cheap or free cures or preventives. Don’t assume that, just because he’s with the government, he’s telling you the truth and the whole truth.
Finally, remember that most accepted science is wrong, the effect of most drugs is 60% due to the placebo effect, and most scientific experiments that get published can’t be replicated.
Critical thinking is skepticism. Wear it like a badge of honor and you’ll live longer.
Blogs on Experts #
- Experts vs. the People - March 2005
- Experts Are Usually Wrong … - January 2009
- Why Are Experts Leading Us Into Despair - April 2020
- Shock Therapy: Scott Adams Scooped Me - May 2020